Reading the valuable information on the website of the American Randonneurs (Randonneurs USA RUSA.org) and their Facebook group, I found an AWESOME website that makes very detailed and well-designed weather forecasts for temperature, chance of rain, wind direction, and speed during brevets.
The website address is www.RandoPlan.com.
For easiest and most convenient use, I recommend using the website from a computer at least the first time, but of course, you could easily use it from your phone's browser.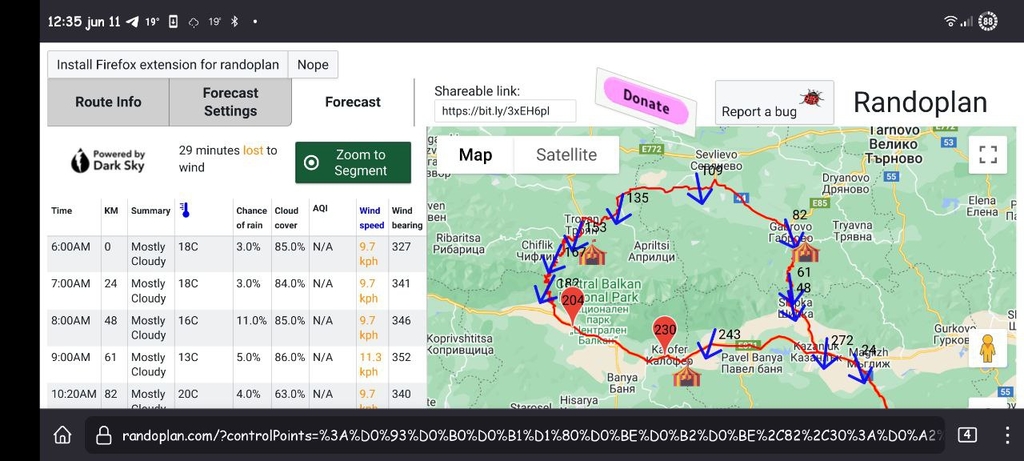
If you use the website RandoPlan.com from your phone's browser to see detailed information about the generated forecast and the map with the GPS track, you need to turn your phone sideways.
Otherwise, if you look at your phone vertically, you will only see the first column of data and missing the other columns with information and missing the map with the GPS track and wind direction.

After the website opens, a menu is loaded, where you need to enter the Route ID of the GPS track from RideWithGPS.com.
For example, in this HOWTO, I will use the GPS track for the Shipka 300 brevet.
The Route ID is the numbers in the URL address of the browser of the GPS track, seen after opening and loading RideWithGPS.com.
In this case, the Route ID is 39776301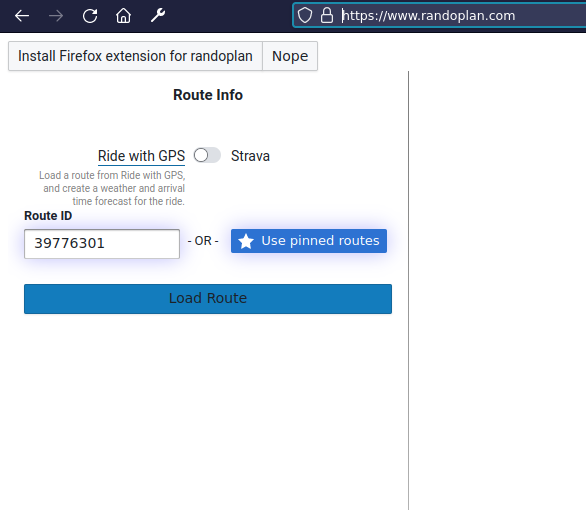
The website www.RandoPlan.com also supports working with GPS tracks from Strava, but when I tested it with a Strava track, the website gave an error. This may be because I do not have a paid subscription in Strava and I use the free access, and in fact, I do not have the ability to create tracks in Strava.
Anyway, I don't think it's a problem, since today every self-respecting randonneur is well acquainted with the best website for creating GPS tracks: RideWithGPS.com :)
After entering the Route ID, press the Load Route button.
A page opens where you need to enter:
1. date and start time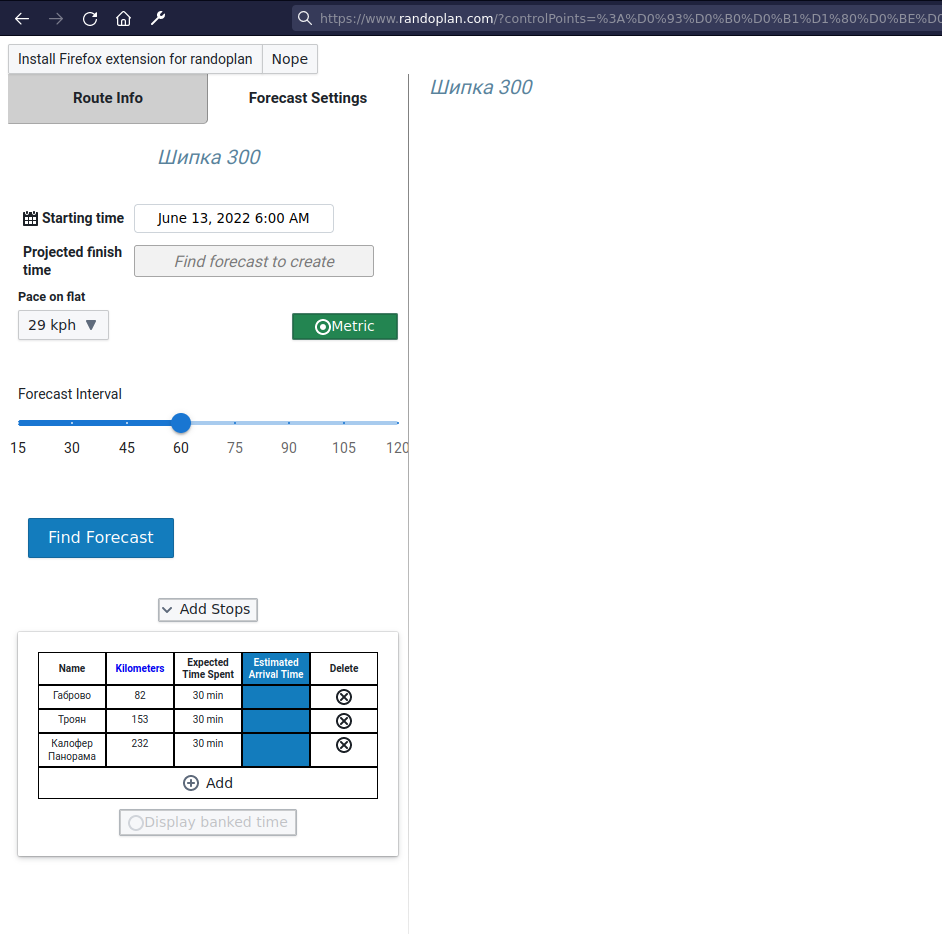
2. below on the right, select Metric to see the information in the metric system, and the degrees should be in Celsius rather than Fahrenheit, as is the default in America.
3. in the Pace on flat field, enter the approximate speed for riding on flat ground, in this case, I entered 29 km/h
4. Below, you can choose the forecast interval, by default, it is 60 minutes, which is completely sufficient.
5. At the bottom, in the Add Stops field, you can add the control points and other places where you plan to stop and the time you plan to spend at each control point.
For the controls, you need to add the name of the control, the kilometer at which it is located on the length of the track, and the duration of the stay at each control on each line.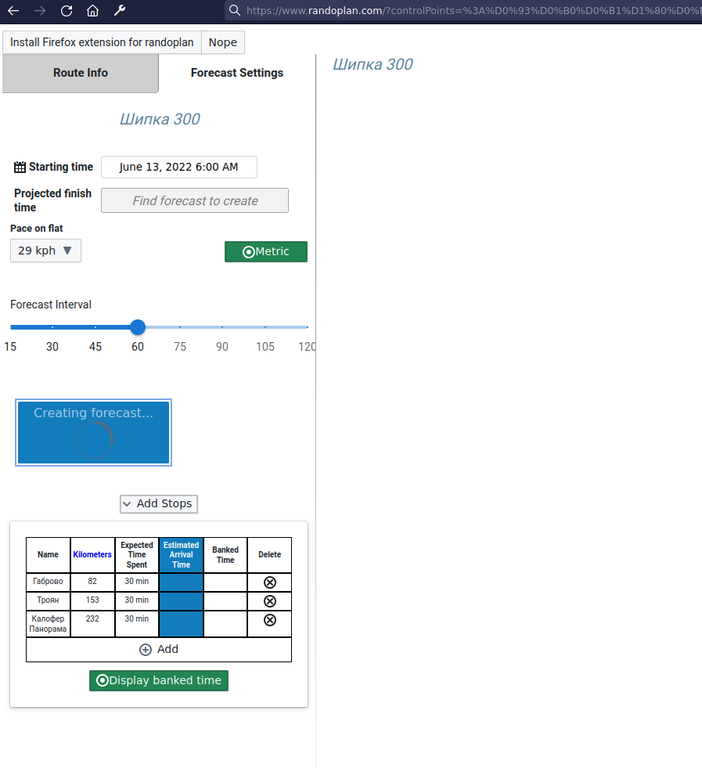
This is very valuable because the website takes into account the time and continues the forecast.
For example, in the Super Randonnee 600 km with 10,000 m elevation, you can make one or two stops for overnight stays for several hours, this time will be taken into account accordingly.
6. Finally, click the blue button above the list of controls Find Forecast
It takes a few seconds to generate the forecast and the map of the route, and everything is ready! 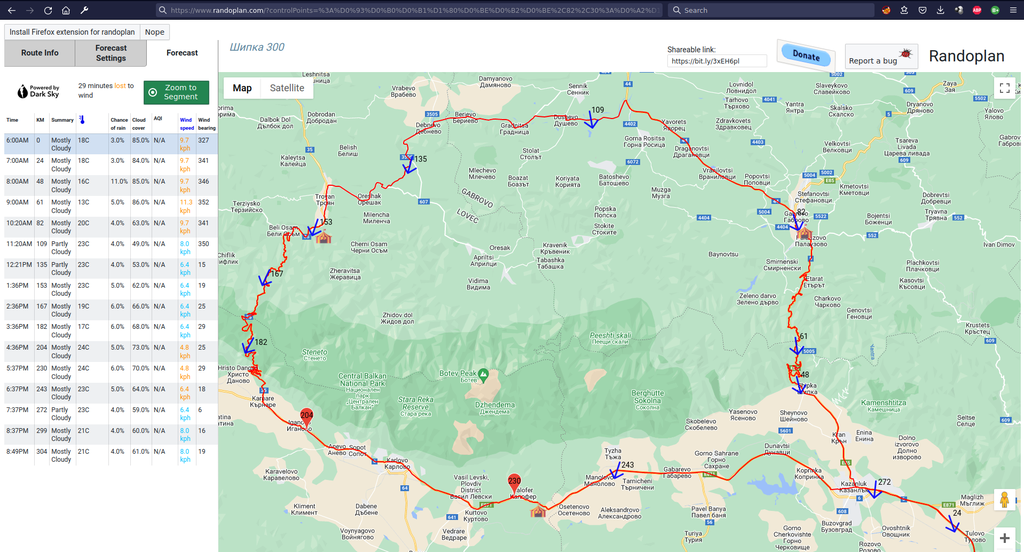
The detailed forecast is provided by Dark Sky, which I have been using through an application on my Android phone for quite some time and I am very satisfied with their forecasts.
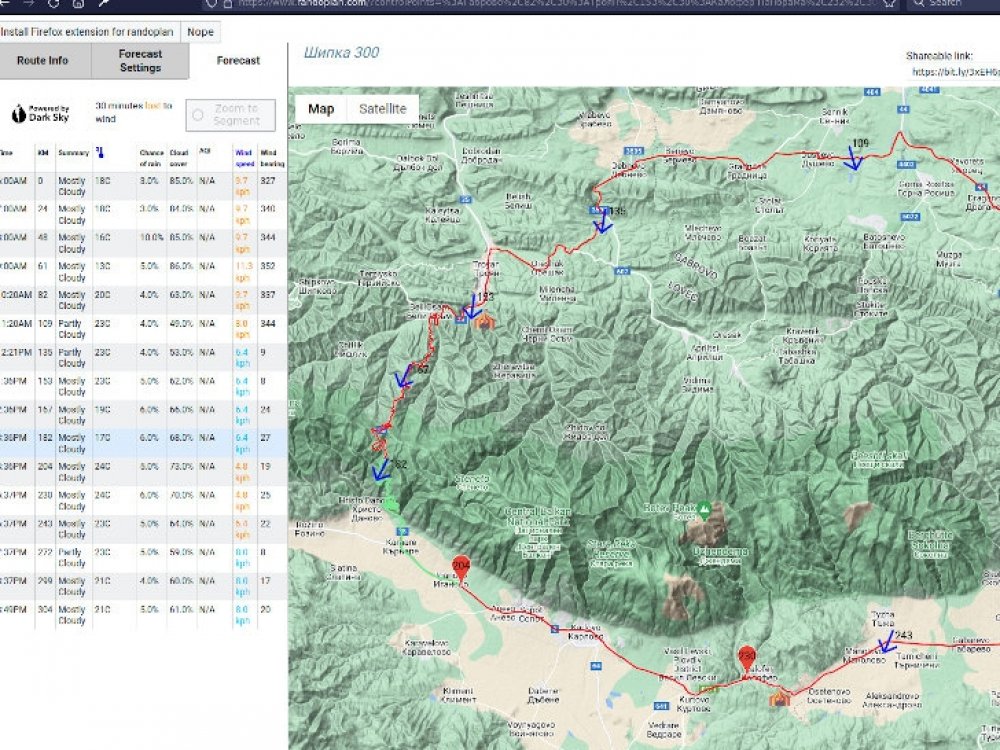
There is some valuable information next to the Dark Sky logo: 29 minutes lost to wind - this is the estimated time that we will lose due to sections of the route with headwind...
Below is a table with the actual forecast for the selected period.
In the left part of the screen, we can see the forecast for the selected period of time. 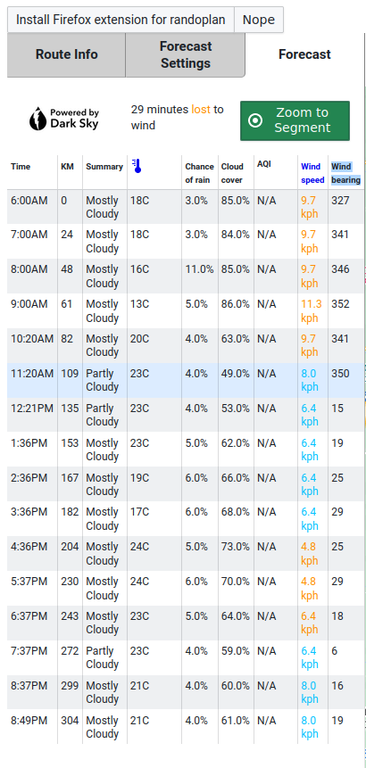
The first column shows the starting time and then the forecast for the selected period, in this case 60 minutes.
At the bottom of the first column, we can see the estimated time of arrival.
The arrival time is calculated based on the constant speed we have set on the initial screen.
The algorithm calculates the probable speed at which you will ride uphill, taking into account also the speed of the headwind and tailwind.
The second column shows the distance.
Next is a column with a summary forecast: Sunny / Cloudy / Light Rain / Thunderstorm, etc. 
Following columns show the temperature, probability of precipitation, percentage of cloud cover, wind speed, and wind bearing...
.....whatever that last field, Wind bearing, means.... :) :) :)
On the right, we have a detailed map of the route, with icons of tents indicating the controls entered on the first screen. We can also see arrows indicating the wind direction.
If the green button Zoom to segment is selected when pointing to each individual row of the forecast on the left, the map on the right changes to show the expected location for the corresponding time period.
Above the map, there is a Shareable link: menu https://bit.ly/3xEH6pl from where you can copy a link to the created forecast and send it to the group with whom you plan to ride the corresponding brevet. :)
On the right, there is a DONATE button, with which you can express your gratitude for the time, effort, and hard work put into creating this EXTREMELY valuable website! 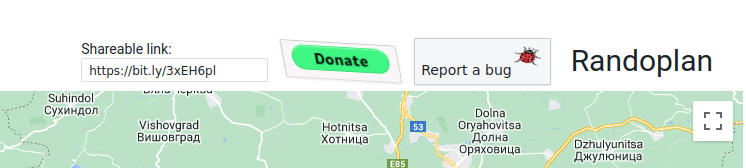
Good luck and see you on the road!